
Data journalism isn’t simply about beautiful charts or infographics. There’s a key message from the Third Asian Investigative Journalism Conference, in which almost half of the workshops are about data journalism — that ideas can blossom from actively seeking, storing, checking and thoroughly combing through your data.
Yoichiro Tateiwa, executive director of Japan’s Center for Money and Politics has a powerful story to illustrate this point. On March 12, 2011, only a day after the Fukushima Daiichi Nuclear Power Plant was hit by a tsunami, through data collected from the U.S. government, Yoichiro found out that the ionizing radiation level near Tokyo was ten times higher than the safety limit. Although the U.S. government advised its citizens to evacuate from Tokyo immediately, Japanese authorities downplayed the advisory as an overreaction. For Yoichiro, Japanese authorities refused to admit the data, even though that means risking the health of millions of Tokyo residents.
“It is amazing what data can tell you; how many stories it can tell you,” Yoichiro Tateiwa said at a workshop. In his case the data is publicly available. In many other cases, journalists would have to spend some time obtaining and combing through the data. What’s wonderful is that data resources are vast, from websites, spreadsheets, maps, satellite images to social media – anything can be the start of a story.
With the right approach in mind, journalists can go very far with data. According to Uncovering Asia 2018’s speakers, here are a few ways data journalism can be used for a story, especially an investigative one.
1/Web Resources
Only 4% of online information is indexed and can be searched by standard search engines like Google or Bing, Columbia Journalism School’s Giannina Segnini said. The rest belongs to the world of Deep Web and Dark Web, where classified information and criminal activities are stored.

According to Segnini, journalists can already do a lot with just that 4%, as long as they have the right tools in hand. As standard search skills don’t normally bring out the best results, Segnini suggests using some advanced operators on search engines, for example Google. Site: following by a domain will give results within only one domain (site:data.gov; site:edu; etc.), or filetype:xls will direct us to spreadsheets. A few other advanced search commands can be found here.
Aside from Google, Segnini also introduced a bunch of websites which she called ‘The Google of databases’, which bring out much more specific, oriented results. Enigma.io is Segnini’s favorite, given its gigantic amount of raw data from governments and organizations such as the UN or IMF. OpenCorporates stores information of millions of companies across the world including Vietnam, Wipo.int has a huge database of registered brands, while Global Open Data Index allows us to compare data from different countries with various indicators. For more tools to look up fiscal records, court papers, customs records, click here.
2/Social Media

The search engines of Facebook, Twitter and LinkedIn don’t always give us full access to all the public information. Luckily, BBC’s Paul Meyers has a special menu for journalists to dig up all the information ever put on these networks, except for ‘Only Me’ content. Stalkscan and PeopleFindThor.dk are great tools to perform thorough searches on Facebook, while Tweet Beaver and Followerwonk are the equivalents for Twitter. Meyers put all of these tools on his website.
When data from social media is too large, the next step for journalists is to collect and comb through this massive amount of data. The data journalism team from KBS (South Korea) got creative: they built an app. A team of developers, news reporters and data analysts created a developer’s account on Twitter, then built an app on that same platform, ran a few commands and found out top keywords, adjectives and topics Trump tweeted in the first six months of 2018. Unshockingly, ‘people’, ‘president’ and his own name, ‘Trump’ are his most used words, while the president’s favorite adjective is ‘great’ and his most loved subject is ‘Trump-Russia affair’.
3/ Satellite Images
Satellite images can be a very useful tool when reporting on conflict or disaster zones. However, its magic doesn’t stop there. According to many speakers at the conference, sometimes the story doesn’t appear until we look at it from a bird’s eye view.
“You have a story, but you need confirmations, correlations to connect the dots, tying up loose ends or clues for where and when,” said Anusuya Datta, executive director of Geospatial Media & Communications. According to Datta, this is when satellite images can save the day. BBC Africa Eye’s usage of satellite images is a great example. In July 2018, a video clip of two women and two children being blindfolded and shot at 22 times by a group of army men surfaced online. No one can be sure which country, let alone where exactly the incident took place, although it can almost certainly be somewhere in Africa. With just a low-resolution clip, BBC Africa Eye used satellite images to find the exact match of the mountain, trees, walls and houses in the clip, hence traced down the exact location where the incident happened. Cameroon’s government, which at first deemed their report ‘fake news’, launched an investigation nevertheless and arrested the executors, who are army members.
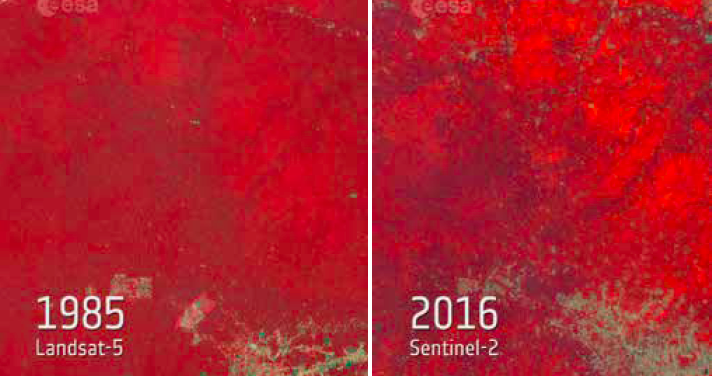
According to Datta, satellite cameras have also helped AP spot a human trafficking ring on the water of Indonesia and Papua New Guinea, after months of circling around without progress. The satellite image AP obtained showed the exact moment two trawlers were loading slave-caught seafood onto a commercial cargo ship. Satellite images also exposed secret Iranian nuclear program in 2015, showed how fast the Amazon is shrinking, and helped Reuters won a prize with its coverage of Myanmar’s ethnic cleansing.
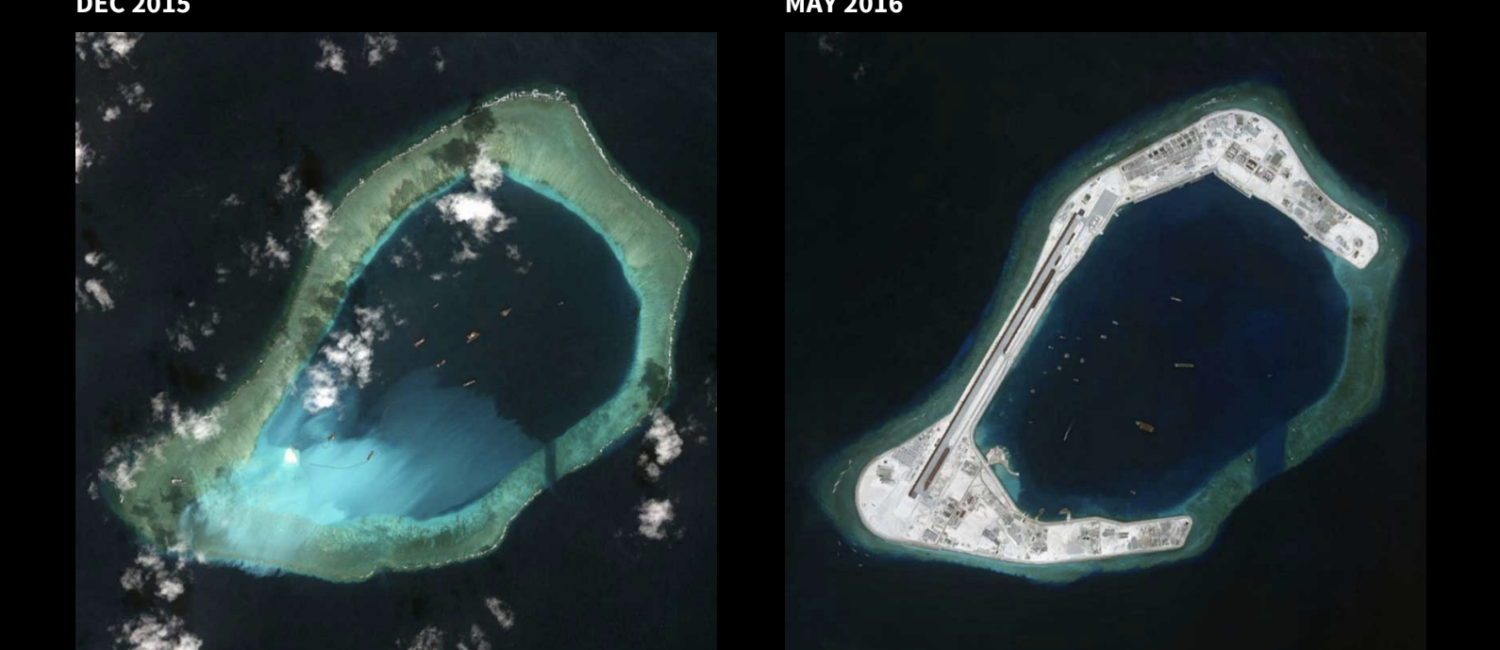
In a more local example, Reuters’ graphics editor Christine Chan said that satellite images is crucial to Reuters’ reporting about the South China Sea. With satellite images, readers can picture the exact geographic changes of the islands, for example the Spratly, just in the past few years.

For starters, Geospatial’s Datta recommended free satellite image services such as NASA’s Landsat, ESA, Bhuvan and Google Earth. A few other services have special options for journalists such as Planet, DigitalGlobe and Airhub.
4/Mapping
Like satellite images, many stories don’t appear until we map it. But reporting doesn’t stop at just looking at maps, according to NBC’s investigative reporter Andrew Lehren. It is crucial to combine data and make a map that speaks.
In his two-part workshop, by combining existing demographic data of New York City with the city police’s data of injured bystanders, Lehren was able to create a map that showed most of the accidents happened to colored people at neighborhoods with a high density of black population. It adds a point to the investigative report In the Line of Fire by Erin Horan. The New York Times uses this type of interactive map extensively, from a series of maps for the 2016 presidential election, a map for the search of the missing MH370, to the map of every building in America.

According to Lehren, beginners can start with a trial account of ArcGIS, a website that allows users to create their own maps with a large resource of existing base maps. Lehren’s step-by-step guide can be found here.
Trang Bui
Centre for Media and Development Initiatives (MDI) is the only member in Vietnam of Global Investigative Journalism Network (GIJN). For more resources on data journalism, journalists can contact MDI for assistance.

